Thursday, July 18, 2019

Lake Erie Harmful Algal Bloom

NOAA and its research partners predict that western Lake Erie will experience a harmful algal bloom (HAB) of cyanobacteria this summer that is larger than the mild bloom in 2018. Scientists expect this year’s bloom to measure greater than a 7 on the severity index. The severity index is based on a bloom’s biomass – the amount of its harmful algae – over a sustained period. The largest blooms, 2011 and 2015, were 10 and 10.5, respectively. Last year’s bloom had a severity of 3.6 considered a mild bloom. However, the size of a bloom is not necessarily an indication of how toxic it is. For more information on the projection click here.

NOAA HAB Forecast Bulletin

Continue reading at: Lake Erie Harmful Algal Bloom

Thursday, July 11, 2019

Tipping Elements - the Achilles Heels of the Earth System — PIK Research Portal

Tipping elements are components of the Earth system of supra-regional scale which - in terms of background climate - are characterized by a threshold behavior. Once operating near a threshold, these components can be tipped into a qualitatively different state by small external perturbations. To compare them with the human body, tipping elements could be described as organs which drastically alter or stop their usual function if certain requirements, such as oxygen supply, are not sufficiently fulfilled.

The threshold behavior is often based on self-reinforcing processes which, once tipped, can continue without further forcing. It is thus possible that the new state of a tipping element persists, even if the background climate falls back behind the threshold. The transition resulting from the exceedance of a system-specific tipping point can be either abrupt or gradual. Its large-scale environmental impacts could endanger the livelihood of millions of people.

hotspots_e.jpg
Map of the most important tipping elements in the Earth System overlain on the Köppen climate classification. There are three groups of tipping elements: melting ice bodies, changing circulations of the ocean and atmosphere, and threatened large-scale ecosystems. Question marks indicate systems whose status as tipping elements is particularly uncertain. Source: PIK, 2017.


Continue reading at: Tipping Elements - the Achilles Heels of the Earth System — PIK Research Portal

11 Critical Global Warming Tipping Points - Job One for Humanity

Global Warming Tipping Points Which Can Create Mass Extinction Within Our Lifetimes

(If you do not understand the basics of what global warming (aka climate change,) is or how it works, we strongly advise you click here first to view some basic illustrations that explain it. If you are not familiar with the 20 major and worst consequences of global warming we strongly recommend you review this page first as it will deepen your understanding of how the global warming tipping points can interact with these other global warming consequences to create a global warming extinction scenario within our lifetimes. Also please note that the global warming extinction process is also sometimes called runaway global warming or irreversible global warming.)

Introduction
"You cannot be called an alarmist if there really is something to be alarmed about." Unknown Source

While you are learning about key global warming tipping points, it is critically important to understand that no compensatory calculations for the effects of any global warming tipping points being crossed were ever included in the UN's Intergovernmental Panel on Climate Change's (IPCC,) calculations for precisely how much we have to reduce our global fossil fuel use to save ourselves from extinction. This is important because the IPCC's global fossil fuel reduction calculations are currently being used by all of the member governments of the United Nations (about 190 countries,) for setting their own internal national fossil fuel reduction programs.

This horrific failure to include crossing any global warming tipping points in our current global and national fossil fuel reduction calculations is also true for the world's most recent 2015 Paris Climate Agreement. As you will soon discover this omission of including proper calculations for crossing global warming tipping points as the world continues to warm is the recipe for mutually assured destruction.

Yes, this failure to include allowance calculations for crossed tipping points also means that the national fossil fuel reduction programs of every member of the United Nations using the 2015 Paris Climate Agreement targets is also based on incomplete and inaccurate calculations. In other words, our current global fossil fuel reduction calculations are based on the inconceivable belief that "everything will work perfectly within our rapidly warming climate systems all of the time and we will never crossing any key global warming tipping points." Unfortunately, the immutable laws of mathematics and physics also do not work that way, particularly as we simultaneously continue to add massively more carbon and methane to our atmosphere each year.

We all know how "everything always goes perfectly as planned all of the time" so, there's nothing really to worry about here or, is there? As you explore the key global warming tipping points described below the shocking meaning to your future wellbeing of our government's not including crossing any global warming tipping points in their calculations for how much we have to reduce our global and national fossil fuel use to prevent extinction will become much clearer to you...

Tipping Points
The major Global warming tipping points within interacting climate, human, and biological systems are:
  1. The total amount of melting ice.
  2. The albedo effect.
  3. The release of methane from the warming of polar permafrost and tundra.
  4. The total amount of water vapor in the atmosphere.
  5. The die-offs of carbon-eating and oxygen-producing sea plankton because of the warming, carbonization, and acidification of the oceans.
  6. The ever-increasing atmospheric heat captured and stored by the oceans and sent to lower levels of the ocean.
  7. The loss of the atmospheric carbon-eating forests because of heat, drought, wildfires, and timber-harvesting or agriculture-related clearcutting.
  8. Soils that normally absorb carbon begin releasing it back into the atmosphere from their previously stored or inherent carbon because of the escalating heat.
  9. The changes in major ocean currents that help to stabilize our weather and seasons.
  10. The global warming-caused pandemic potential. When ancient ice, glaciers, permafrost, or frozen tundra melts, it releases still-living bacteria and viruses never seen before.
  11. Total weight of rising seas and melting ice shifting. Although research is sparse in this area, it has been posited that the total massive weight change from all ice melt areas (where ice covers land masses) as well as the heating, expanding and shifting weight effect on seas caused by global warming can move existing tectonic plates.
Chapter_4_Global_Warming_Tipping_Points.png
Continue reading at: 11 Critical Global Warming Tipping Points - Job One for Humanity

The urgency of Arctic change - ScienceDirect

This article provides a synthesis of the latest observational trends and projections for the future of the Arctic. First, the Arctic is already changing rapidly as a result of climate change. Contemporary warm Arctic temperatures and large sea ice deficits (75% volume loss) demonstrate climate states outside of previous experience. Modeled changes of the Arctic cryosphere demonstrate that even limiting global temperature increases to near 2 °C will leave the Arctic a much different environment by mid-century with less snow and sea ice, melted permafrost, altered ecosystems, and a projected annual mean Arctic temperature increase of +4 °C. Second, even under ambitious emission reduction scenarios, high-latitude land ice melt, including Greenland, are foreseen to continue due to internal lags, leading to accelerating global sea level rise throughout the century. Third, future Arctic changes may in turn impact lower latitudes through tundra greenhouse gas release and shifts in ocean and atmospheric circulation. Arctic-specific radiative and heat storage feedbacks may become an obstacle to achieving a stabilized global climate. In light of these trends, the precautionary principle calls for early adaptation and mitigation actions.


Recent Arctic erosion and loss of permafrost along the Alaskan coast near Drew Point. Thawing land ice (white) is clearly visible. This is part of the current rapid changes happening in the Arctic. Photo from USGS (https://on.doi.gov/arctic-coasts).

Continue reading at: The urgency of Arctic change - ScienceDirect

Polar vortex breakdown | Arctic Sea Ice News and Analysis

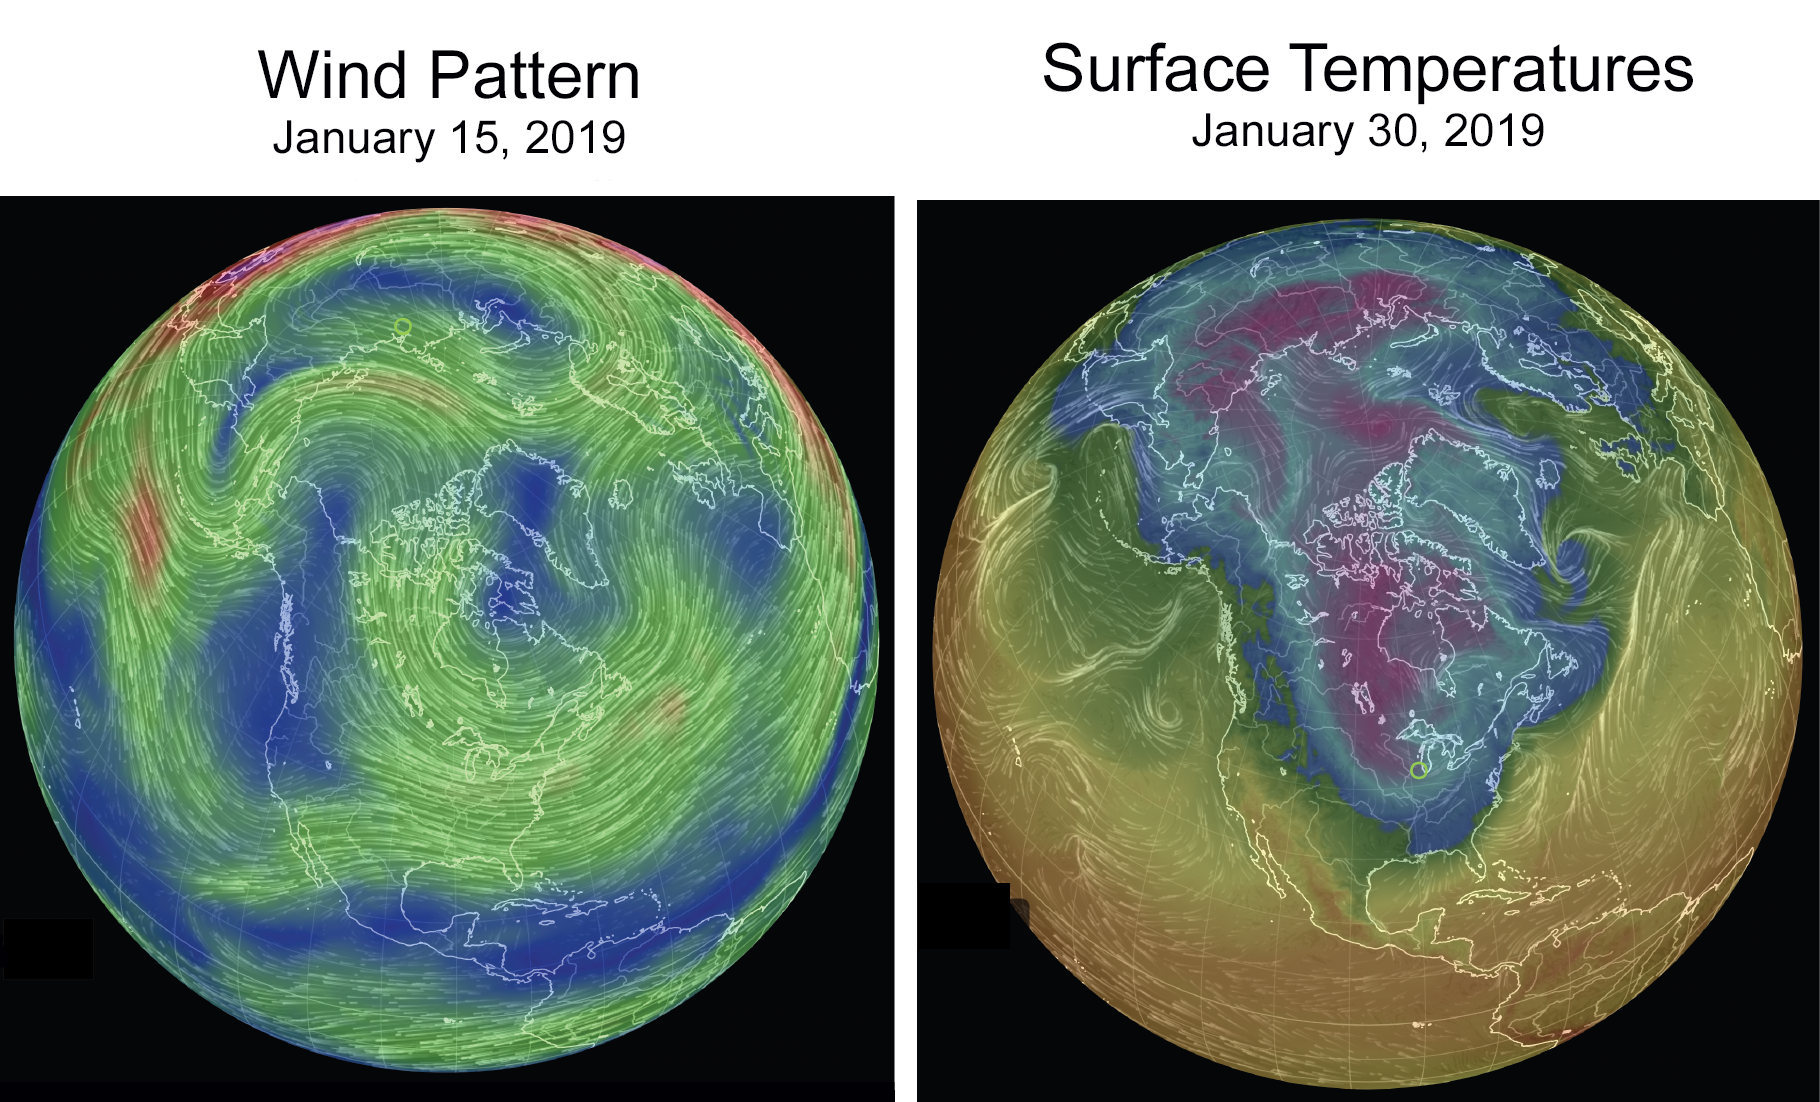
In January 2019, a pattern of high-altitude winds in the Arctic, better known as the polar vortex, weakened, sweeping frigid air over North America and Europe in the second half of the month. Arctic sea ice extent remained well below average, but temperatures in the far north were closer to average than in past years.

The left image shows atmosphere winds (70 millibars, about 60,000 feet altitude) on January 15, 2019. North America is in the center of this view. The right image shows surface air temperatures on January 30, 2019. For reference, Chicago was -26 degrees Celsius (-15 degrees Fahrenheit) on this morning (dark blue color). Credit: earth.nullschool.net 

Arctic sea ice extent for January averaged 13.56 million square kilometers (5.24 million square miles). This was 860,000 square kilometers (332,000 square miles) below the 1981 to 2010 long-term average sea ice extent, and 500,000 square kilometers (193,000 square miles) above the record low for the month set in January 2018. January 2019 was the sixth lowest January extent in the 1979 to 2019 satellite record.

Continue reading at: Polar vortex breakdown | Arctic Sea Ice News and Analysis

The Keeling Curve: A daily record of atmospheric carbon dioxide since 1958 from Scripps Institution of Oceanography at UC San Diego

The Keeling Curve since 1958
The Keeling Curve: A daily record of atmospheric carbon dioxide since 1958 from Scripps Institution of Oceanography at UC San Diego.


Global Warming Is Messing with the Jet Stream. That Means More Extreme Weather.

A new study links the buildup of greenhouse gas emissions to more frequent heat waves, floods and droughts in the Northern Hemisphere.

Greenhouse gases are increasingly disrupting the jet stream, a powerful river of winds that steers weather systems in the Northern Hemisphere. That's causing more frequent summer droughts, floods and wildfires, a new study says.


The speed and waviness of the northern jet stream, a river of wind across the Northern Hemisphere, is affected by the temperature difference between the Arctic and mid-latitudes. Credit: NASA

The findings suggest that summers like 2018, when the jet stream drove extreme weather on an unprecedented scale across the Northern Hemisphere, will be 50 percent more frequent by the end of the century if emissions of carbon dioxide and other climate pollutants from industry, agriculture and the burning of fossil fuels continue at a high rate.

In a worst-case scenario, there could be a near-tripling of such extreme jet stream events, but other factors, like aerosol emissions, are a wild card, according to the research, published today in the journal Science Advances.

Continue reading: Global Warming Is Messing with the Jet Stream. That Means More Extreme Weather.