There are paths out of the worst of the crisis...
Iceland Glacier Gone

Wednesday, November 27, 2019
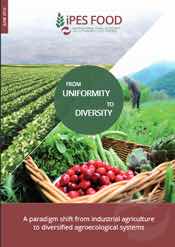
From Uniformity to Diversity - IPES Food Report - Agroecology Now!
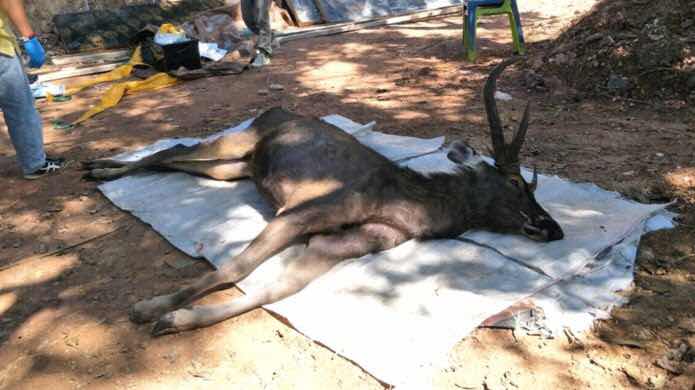
Thai deer found dead with 7kg of 'underwear, plastic bags' in stomach - BBC News
Unlike most “developed “ countries, Thailand is to ban single use plastic next year...

Could Victoria Falls dry up?
Climate criminals and deniers Brave New World: Droughts in California, Zimbabwe and many other places- and flash flooding and mudslides in others...
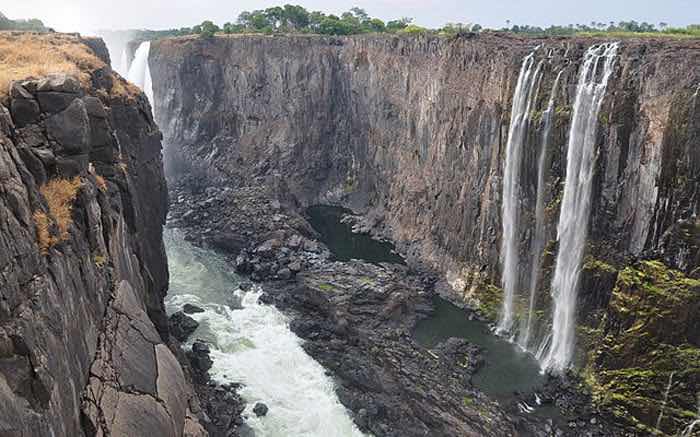
Victoria Falls during dry season. Picture: Victoriafallstourism.or
Continue reading at: Could Victoria Falls dry up?
Friday, November 22, 2019
The discrepancy between countries’ planned fossil fuel production and global production levels consistent with limiting warming to 1.5°C or 2°C
The discrepancy between countries’ planned fossil fuel production and global production levels consistent with limiting warming to 1.5°C or 2°C

Continue reading at: Home - Production Gap
Continue reading at: Home - Production Gap
Sunday, November 17, 2019
World Scientists’ Warning of a Climate Emergency | BioScience | Oxford Academic
...we declare, with more than 11,000 scientist signatories from around the world, clearly and unequivocally that planet Earth is facing a climate emergency.

Figure: Change in global human activities from 1979 to the present. These indicators are linked at least in part to climate change. In panel (f), annual tree cover loss may be for any reason (e.g., wildfire, harvest within tree plantations, or conversion of forests to agricultural land). Forest gain is not involved in the calculation of tree cover loss. In panel (h), hydroelectricity and nuclear energy are shown in figure S2. The rates shown in panels are the percentage changes per decade across the entire range of the time series. The annual data are shown using gray points. The black lines are local regression smooth trend lines. Abbreviation: Gt oe per year, gigatonnes of oil equivalent per year. Sources and additional details about each variable are provided in supplemental file S2, including table S2.
Continue reading at: World Scientists’ Warning of a Climate Emergency | BioScience | Oxford Academic
Friday, November 15, 2019
Subscribe to:
Comments (Atom)