Friday, August 23, 2019

Rivers in the Sky: How Deforestation Is Affecting Global Water Cycles

A growing body of evidence indicates that the continuing destruction of tropical forests is disrupting the movement of water in the atmosphere, causing major shifts in precipitation that could lead to drought in key agricultural areas in China, India, and the U.S. Midwest.
very tree in the forest is a fountain, sucking water out of the ground through its roots and releasing water vapor into the atmosphere through pores in its foliage. In their billions, they create giant rivers of water in the air – rivers that form clouds and create rainfall hundreds or even thousands of miles away.
But as we shave the planet of trees, we risk drying up these aerial rivers and the lands that depend on them for rain. A growing body of research suggests that this hitherto neglected impact of deforestation could in many continental interiors dwarf the impacts of global climate change. It could dry up the Nile, hobble the Asian monsoon, and desiccate fields from Argentina to the Midwestern United States.
Moisture produced by the world's forests generates rainfall thousands of miles away.
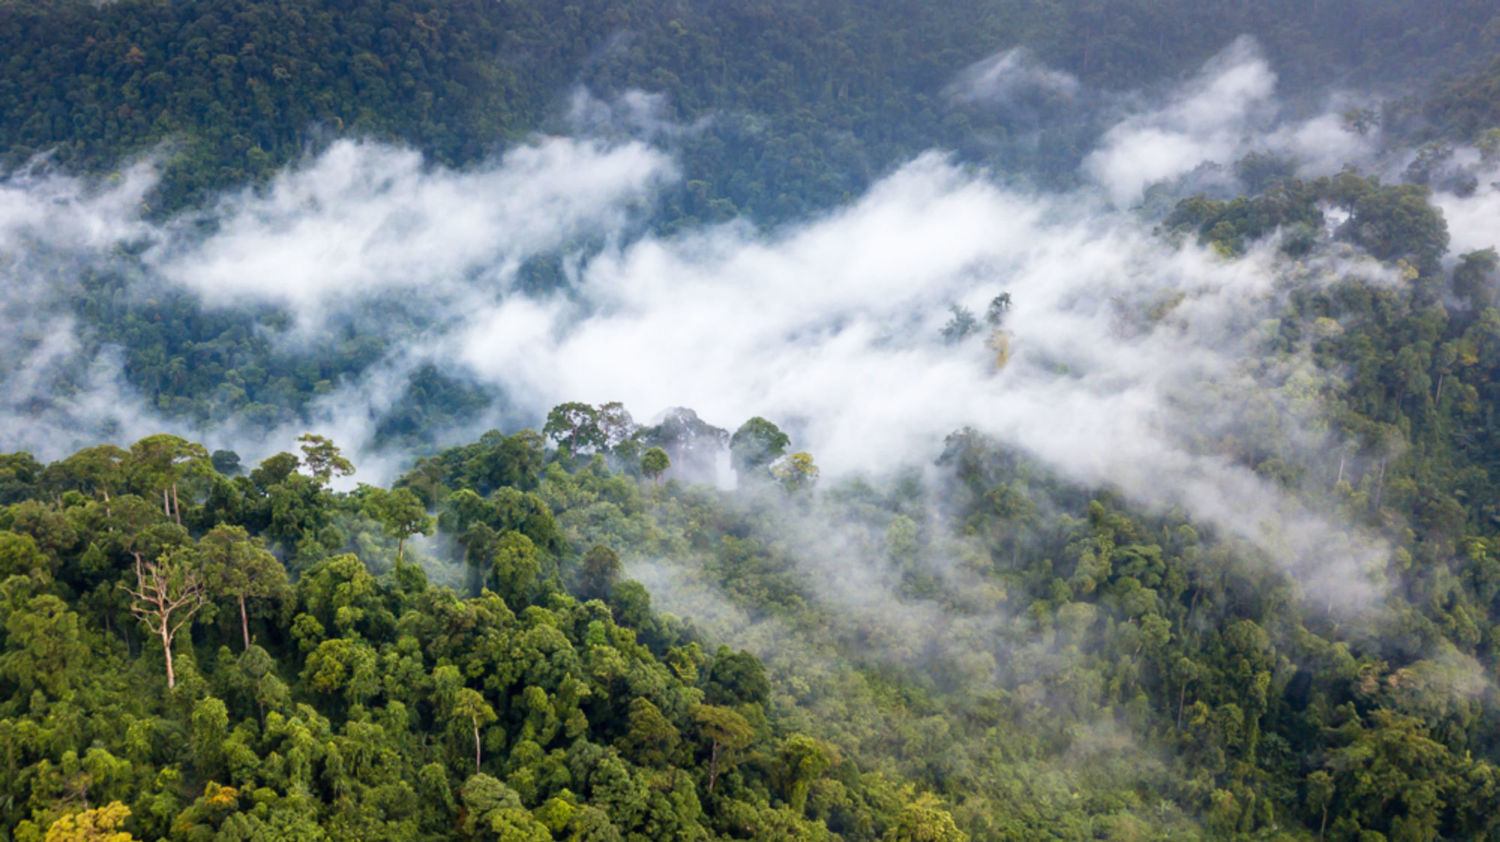
Moisture produced by the world's forests generates rainfall thousands of miles away. RICHARD WHITCOMBE / SHUTTERSTOCK

Until recently, the nuggets of data delivering such warnings were fragmented and often relegated to minor scientific journals. But the growing concerns came to the fore in reports presented at two forest forums held by the United Nations and the Norwegian government in recent weeks.
In Norway, Michael Wolosin of the U.S. think tank Forest Climate Analytics and Nancy Harris of the World Resources Institute published a study that concluded that “tropical forest loss is having a larger impact on the climate than has been commonly understood.” They warned that large-scale deforestation in any of the three major tropical forest zones of the world – Africa’s Congo basin, southeast Asia, and especially the Amazon – could disrupt the water cycle sufficiently to “pose a substantial risk to agriculture in key breadbaskets halfway round the world in parts of the U.S., India, and China.”
Trees pull water from the ground and release water vapor through their leaves, generating atmospheric rivers of moisture.
Trees pull water from the ground and release water vapor through their leaves, generating atmospheric rivers of moisture. WORLD RESOURCES INSTITUTE

Continue reading at: Rivers in the Sky: How Deforestation Is Affecting Global Water Cycles

Wednesday, August 21, 2019

The advisory list for self classification of hazardous substances

The Danish Environmental Protection Agency publishes an advisory list for self classification of chemical substances – with advisory classifications of more than 54,000 substances.

The advisory list for self classification of hazardous substances

Saturday, August 17, 2019

Why The Green New Deal Cuts Consumer Energy Costs & Unemployment

The Green New Deal is a proposal to transition the United States entirely to clean, renewable, zero-emission energy in all energy sectors, to promote removal of carbon from the air through natural reforestation and land preservation, and to create jobs. By focusing on renewable energy that is both clean and zero-emission, the Green New Deal reduces, in one fell swoop, energy insecurity due to the fossil fuel and nuclear industries, 62,000 deaths and millions more illnesses annually from US energy-related air pollution, and the US’ contribution to global warming.

Critics claim, though, that the Green New Deal is unaffordable and uneconomical and will sink the US into more debt. Having led the research team that developed science-based plans to transition each of the 50 states to 100% wind, water, and solar (WWS) in all energy sectors (electricity, transportation, heating and cooling, and industry), we conclude the opposite is true: the benefits of clean energy systems greatly exceed the costs. 10 other independent research groups similarly find that 100% renewable energy systems are low cost without fossil fuels with carbon capture or nuclear power.

However, a 100% transition of all energy sectors by 2030, while technically and economically possible and desirable, may not occur that fast for social and political reasons. As such, we have consistently proposed a goal of 80% transition by 2030 and 100% no later than 2050 and hopefully earlier. The electricity sector, for example, can transition by 2035. If accomplished worldwide, this goal limits global warming to 1.5 degrees Celsius.
Continue reading: Why The Green New Deal Cuts Consumer Energy Costs & Unemployment

Across U.S., Toxic Blooms Pollute Lakes

TOLEDO, Ohio – In the middle of a muggy summer night, Keith Jordan got an urgent text: Toledo’s tap water wasn’t safe to drink.

“I thought it was a joke," said Jordan, who works with at-risk youth in Toledo’s inner city. He went back to sleep. When he got up a few hours later, he took a shower and had a cup of coffee, then turned on the news.
“They were saying don't drink the water, don’t take a shower – the water is messed up,” Jordan said. “You couldn’t even touch the water. It was something you could not believe was happening here in Toledo.”

That was Aug. 2, 2014. For the next three days, half a million people in and around this industrial city at the western edge of Lake Erie scrambled to find safe water.
Continue reading at: Across U.S., Toxic Blooms Pollute Lakes

A Quarter of Humanity Faces Looming Water Crises - The New York Times

BANGALORE, India — Countries that are home to one-fourth of Earth’s population face an increasingly urgent risk: The prospect of running out of water.

From India to Iran to Botswana, 17 countries around the world are currently under extremely high water stress, meaning they are using almost all the water they have, according to new World Resources Institute data published Tuesday.
Many are arid countries to begin with; some are squandering what water they have. Several are relying too heavily on groundwater, which instead they should be replenishing and saving for times of drought.
In those countries are several big, thirsty cities that have faced acute shortages recently, including São Paulo, Brazil; Chennai, India; and Cape Town, which in 2018 narrowly beat what it called Day Zero — the day when all its dams would be dry.
Continue reading at: A Quarter of Humanity Faces Looming Water Crises - The New York Times

National Drive Electric Week 2019 - Event Map

National Drive Electric Week™ is September 14-22, 2019.
Join us for a celebration near you.
Image result for National Drive Electric Weekâ„¢ is September 14-22, 2019
If you're thinking of organizing or helping at an event, please join us for a National Drive Electric Week Webinar:
Drive Electric Week: Engaging With Media Tuesday , August 20, 2019 at 9:00 am Pacific/12:00 pm Eastern
Drive Electric Week: Engaging With Attendees Tuesday , August 27, 2019 at 9:00 am Pacific/12:00 pm Eastern

National Drive Electric Week 2019 celebrations will take place across the US and other countries. The map below shows all of the event locations. Click on a pin to get more information about any of the 238 2019 events.
Continue reading at: National Drive Electric Week 2019 - Event Map

A new map is the best view yet of how fast Antarctica is shedding ice | Science News

The research could help improve projections of sea level rise
Decades of satellite observations have now provided the most detailed view yet of how Antarctica continually sheds ice accumulated from snowfall into the ocean.
Antarctica
ICE ICE BABY  Glaciologists used observations from a cohort of satellite missions over decades to create the most detailed map yet of ice flow across Antarctica. ΑΝΑΣΤΑΣΊΑ ΠΟΡΤΝΆ/WIKIMEDIA COMMONS (CC BY-SA 4.0)

The new map is based on an ice-tracking technique that is 10 times as precise as methods used for previous Antarctic surveys, researchers report online July 29 in Geophysical Research Letters. That offered the first comprehensive view of how ice moves across all of Antarctica, including slow-moving ice in the middle of the continent rather than just rapidly melting ice at the coasts. 
Charting Antarctic ice flow so exactly could reveal the topography of the ground underneath, as well as improve forecasts for how much ice Antarctica stands to lose to the ocean in the future. Ice melting off the continent is already known to be a driver of global sea level rise (SN: 7/7/18, p. 6).
Glaciologists at the University of California, Irvine, uncovered subtle movements of Antarctic ice with a kind of measurement called synthetic-aperture radar interferometric phase data. By using a satellite to bounce radar signals off a patch of ice, researchers can determine how quickly that ice is moving toward or away from the satellite. Combining observations of the same spot from different angles reveals the speed and direction of the ice’s motion along the ground.
Continue reading at: A new map is the best view yet of how fast Antarctica is shedding ice | Science News